GeoJSON with p5js
I’m a creative coder and a GIS engineer then what I wanted to do is creative coding with GIS data.
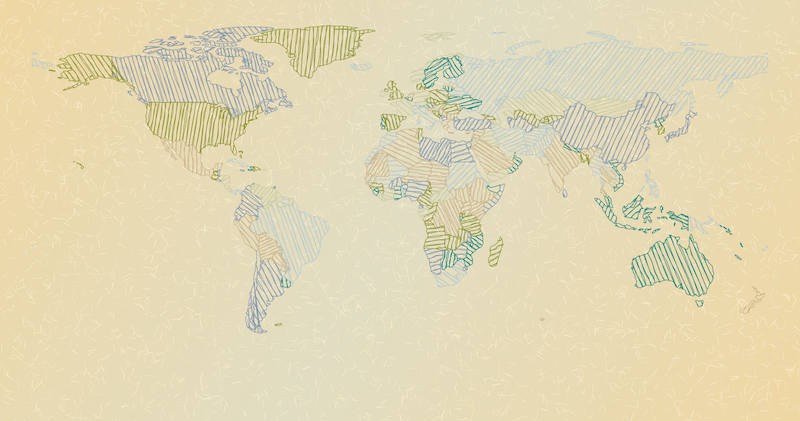 World atlas created with p5js
I usually handle GIS data in GIS software off course. In this blog post, I’d like to try visualize GIS data with p5.js!
Note: This is a kind of art. The geographical precisions are out of consideration.
Prerequisites
In this post, there are some prerequisites to make the explanations easy.
- Features in the GeoJSON file are all Polygon.
- The coordinate system of the GeoJSON is geographic coordinates, which means east to west is -180 to 180 and south to north is -90 to 90.
Create the GeoJSON data
I traced NZ at geojson.io.
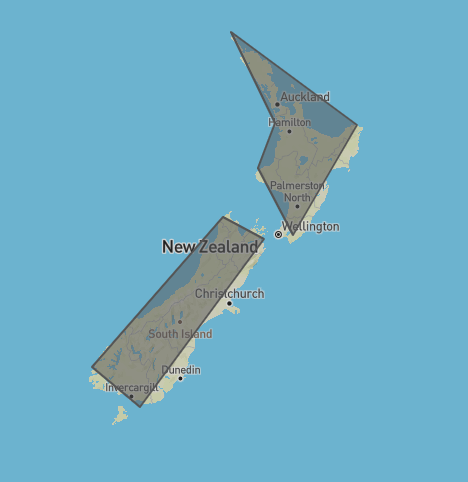 traced NZ on geojson.io
{
  "type": "FeatureCollection",
  "features": [
    {
      "type": "Feature",
      "properties": {},
      "geometry": {
        "type": "Polygon",
        "coordinates": [
          [
            [172.705078, -34.270835],
            [174.638671, -37.509725],
            [173.891601, -39.061849],
            [175.429687, -41.310823],
            [178.242187, -37.579412],
            [172.705078, -34.270835]
          ]
        ]
      }
    },
    {
      "type": "Feature",
      "properties": {},
      "geometry": {
        "type": "Polygon",
        "coordinates": [
          [
            [172.353515, -40.713955],
            [166.596679, -45.521743],
            [168.706054, -46.739860],
            [171.694335, -43.897892],
            [174.155273, -41.442726],
            [172.353515, -40.713955]
          ]
        ]
      }
    }
  ]
}
The GooJSON is not enough to use because of the structure requirements when you load the data in JavaScript. I need add a pair of brackets. The GeoJSON will be looks like this.
[
  {
      "type": "FeatureCollection",
      "features": []
  }
]
Save the GeoJSON as nz.geojson.
Code the sketch!
sketch.js
-
First I need to load the GeoJSON file as a object of JavaScript. Then you can call boundary in setup().
let boundary; function preload(){ boundary = loadJSON("nz.geojson"); } -
Let’s get the longitude and latitude of each polygons following the structure of GeoJSON.
-
The area of New Zealand is between 160 to 180 in longitude and -50 to -30 in latitude. To adjust these to the extent of the canvas, convert them wiht map().
-
Draw the polygons with beginShape() and endShape().
let padding = 20;

function setup(){
    createCanvas(windowHeight, windowHeight);
    background('#67a5da');

    let geom;
    let polygons;
    let coords;
    let features = boundary[0].features;

    fill('#81b214');
    stroke('#fff');
    for (let i = 0; i < features.length; i++) {
        geom = features[i].geometry;
        polygons = geom.coordinates;
        coords = polygons[0];

        beginShape();
        for (let j = 0; j < coords.length; j++) {
            let lon = coords[j][0];
            let lat = coords[j][1];
            let x = map(lon, 160, 180, 0+padding, width-padding);
            let y = map(lat, -50, -30, height-padding, 0+padding);
            vertex(x,y);
        }
        endShape(CLOSE);
    }
}
The final result is like this.
 geojson with p5.js
References
- Natural Earth: Natural Earth is a public domain map dataset.
- geojson.io: A fast, simple tool to create, change geojson.